Research Article | | Peer-Reviewed

Quality and Chlorine Demand of Private Raw Borehole Water in the City of Kara, Togo

Received: 18 November 2024     Accepted: 19 December 2024     Published: 27 December 2024
Views:       Downloads:
Abstract

The reliance on borehole water necessitates a thorough understanding of its quality. Due to water shortage, many households in the city of Kara use water from boreholes directly supplied untreated in the dry and wet seasons. Therefore, this work aimed to investigate the chlorine demand of raw water from private boreholes and perform a spatiotemporal evaluation of the water quality in the city of Kara, Togo. Two sampling campaigns spread over dry (DS) and rainy (RS) seasons in April and August 2023, were carried out to capture seasonal and spatial differences across various boreholes (n=32) in the study area. The physicochemical parameters and germ indicators of fecal contamination were assessed via the standardized method (AFNOR) and WHO Guidelines for Drinking Water Quality (GDWQ). The correlation matrix analysis revealed a complex effect from the dissolution of local rocks (amphibolites, pyroxenites, etc.) and anthropogenic activities. Water was noncompliant concerning faecal contamination in 84.3% of the cases in the dry season (DS) and 96.37% of the cases in the rainy season (RS). The color, TH, TAC, turbidity, FeT, nitrate ion, and electrical conductivity values for some boreholes were outside the GDWQ values. Boreholes F8, F9, and F25 have very high Larson corrosion index (LR>1.2). The chlorine demand varies according to the season, ranging from 0.25 to 6.0 mg/L in DS and from 0.25 to 2.45 mg/L in RS. Regular monitoring is needed to ensure safe drinking water from boreholes in Kara.

Published in American Journal of Applied Chemistry (Volume 12, Issue 6)
DOI 10.11648/j.ajac.20241206.14
Page(s) 158-172
Creative Commons

This is an Open Access article, distributed under the terms of the Creative Commons Attribution 4.0 International License (http://creativecommons.org/licenses/by/4.0/), which permits unrestricted use, distribution and reproduction in any medium or format, provided the original work is properly cited.

Copyright

Copyright © The Author(s), 2024. Published by Science Publishing Group

Keywords

Chlorine Demand, Private Borehole Water, Larson Corrosion Index, Germs Indicator of Faecal Contamination

1. Introduction
Water is a critical resource that is essential for life and economic development. In many developing countries, groundwater from boreholes is a primary source of all types of drinking water . However, the quality of this water can vary significantly due to various environmental and anthropogenic factors . Different types of treatment are used to ensure the quality of raw water, depending on human skills and locally available techniques. The most commonly used chemical disinfection agents are chlorine (Cl2) and its congeners, such as hypochlorite ions (ClO-), chlorine dioxide (ClO2), iodine, ozone, and UV radiation . However, chlorination remains the primary disinfection method because chlorine ensures protection against microbiological recontamination of treated water for several days. Furthermore, disinfection by water is less expensive and easier to handle and can be used at the individual, familial, and community levels . Recent works revealed that although freshwater chlorination ensures drinking water safety worldwide, it can also affect the fecal microbiota, revealing the crucial role of this technique in human health and disease . Based on precautionary principles, determining the correct dose is very important for reducing the high level of disinfection byproducts (DBPs) suspected to be harmful to humans.
In Kara, the reliance on borehole water necessitates a thorough understanding of its quality and the demand for disinfectants such as chlorine. Indeed, Togo's urban areas have been facing significant drinking water shortages globally for several years, especially during the dry season. The city of Kara and surrounding districts such as Niamtougou, Defale, and Pagouda are supplied by the Kozah dam, whose maximum production capacity has been estimated at 7,500 m3/day since the 1980s according to Togolese Water Company (TdE) Activity Report in 2022, through the only existing production unit. This situation leads to challenges such as falling pressure, disruption of the water supply, and shortages, especially during the dry season. To compensate for the lack of public drinking water supply and meet their needs, people have turned to water sources that are more easily accessible but sometimes of poor quality , making boreholes an essential resource for domestic and drinking water supply. The start-up of the second treatment plant of the Kozah dam in 2023 mitigated these shortages by increasing the maximum production capacity to approximately 15,500 m3/day . Unfortunately, the extension of the TdE water distribution network does not cover all suburban areas of the commune of Kara. Furthermore, the capacity of the Kozah dam could be challenging during the dry season because of the increased temperature related to climate change . Therefore, in the city of Kara and its suburbs, many households use water from boreholes directly supplied untreated in the dry and wet seasons. The minimum treatment generally envisaged is disinfection after the physicochemical assessment of water quality. The most accessible and cost-effective chemical reagent for use is chlorine in liquid form (bleach) or solid form (calcium hypochlorite) .
Therefore, this study aims to evaluate physicochemical water quality parameters and the chlorine demand of raw water from private boreholes in Kara. By identifying the factors influencing these variations, we aim to provide insights to improve water treatment practices and ensure safe domestic drinking water supplies.
2. Materials and Methods
2.1. Study Area
The commune of Kozah 1, commonly known as the city of Kara, has four cantons (Lama, Lassa, Soumdina and Landa) located in Kozah Prefecture. The city is located in the northern part of Togo, 420 km from the capital, between longitudes 1°8'24 and 1°19'18 East and latitudes 9°29'24 and 9°42'0 North. It is the largest town located in the northern part of Togo , with a population of 158,090, representing 81.65% of the total population of commune Kozah 1, according to data from the 5th General Census of Population and Housing . In 2030, the city of Kara is estimated to have a population of 223,443 people. The city experiences a Tropical Sudanese climate characterized by distinct wet and dry seasons, which significantly impact annual rainfall and groundwater quality. Two major high-pressure air masses, Harmattan and the Monsoon influence Togo's climate. The interaction between these air masses creates an intertropical front (ITF), whose fluctuations determine seasonal patterns . The city of Kara, in Kozah Prefecture, which has a population density of 256 inhabitants per square kilometer, is above the national average of 143 inhabitants per square kilometer and records annual cumulative rainfall between 1,110 and 1,285 mm, with an average annual temperature of 27°C . In 2019, the municipality of Kara adopted its first municipal development plan to strengthen local governance and monitor access to basic social services such as the drinking water supply and sanitation . The region of Kara, one of the five administrative districts of the country (Figure 1), has an urbanization rate of 28.9%, second only to the Greater Lomé district (a part of the maritime region), which is estimated at 100% . Rapid population growth, combined with the socioeconomic challenges faced by developing countries, clearly contributes to urbanization, which is difficult to manage, and the city of Kara is no exception. Most of the urban areas corresponding to the older districts are connected to the drinking water network provided by the TdE.
2.2. Sampling and Data Collection
The present research was conducted in the city of Kara, where 32 water samples (n = 32) were collected from private boreholes. The boreholes sampled are distributed across various neighborhoods, representing different geological formations, such as the Lassa-Soumdina Leucocratic granulites of the Kabye Massif (GSL) and the Kara-Niamtougou Unit (UKN) , for borehole locations (Figure 1). Two sampling campaigns were conducted to ensure the capture of both dry (April 2023) and rainy (August 2023) seasons. Sampling was carried out to obtain good spatial coverage of the study area. The groundwater samples were collected in polyethylene bottles with a capacity of 1.5 L for physicochemical analysis, while samples for microbiological analyses were collected in sterile borosilicate glass bottles. The microbiological and physicochemical analysis samples were transported in a cool box at 4°C to inhibit bacterial multiplication from the site to the laboratory within 2 hours .
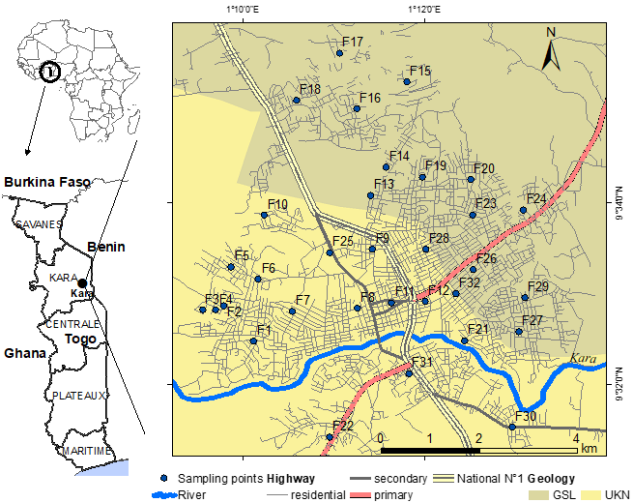
Figure 1. Geographical location of the study area along with groundwater sampling stations in the city of Kara.
GSL = Lassa-Soumdina Leucocratic granulites of the Kabye Massif
UKN = orthogneiss, gneiss and amphibolite of the Kara-Niamtougou Unit
2.3. Physicochemical Analysis
All physicochemical parameters were measured using standard references. Basic water quality parameters such as temperature (T°C), hydrogen potential (pH), electrical conductivity (EC), and turbidity were measured on-site using portable equipment (Table 1). The calibration of the instruments was conducted before each measurement. Volumetric titration with ethylenediaminetetraacetic acid (EDTA) was used to assess the hardness of essential cations in water (Mg2+) and (Ca2+). A GENESYS UV‒Vis ultraviolet spectrophotometer was used to measure the remaining parameters. The chloride (Cl-) and bicarbonate ( ) concentrations were determined via Mohr's method and titration with concentrated acid, respectively. Principal component analysis (PCA) (Origin Software) was used to highlight correlations between the various physicochemical parameters and understand the processes responsible for mineralization.
Table 1. Methods and equipment used for physicochemical analysis.

Parameters

Method

Equipment

Color

Photometry

HANNA H197727

pH

Electrometry

WTW pH 3110/ SET2

Turbidity

Nephelometry

HACH 2100Qis

Conductivity

Conductometry

WTW Cond 330i/SET

TA - TAC

Titrimetric Method

-

HCO3-

Titrimetric Method

-

Ca2+

Titrimetric Method

-

Mg2+

Titrimetric Method

-

OxKMnO4

Hot Method

-

Cl-

Mohr's Method

-

SO42-

Nephelometry

Molecular Absorption Spectrophotometer

GENESYS UV‒Vis

NH4+

Nessler Method

Molecular Absorption Spectrophotometer

GENESYS UV‒Vis

NO2-

Spectrophotometry

Molecular Absorption Spectrophotometer

GENESYS UV‒Vis

NO3-

Spectrophotometry

Molecular Absorption Spectrophotometer

GENESYS UV‒Vis

FeTotal

Spectrophotometry

Molecular Absorption Spectrophotometer

GENESYS UV‒Vis

PO43-

Spectrophotometry

Molecular Absorption Spectrophotometer

GENESYS UV‒Vis

Silica

Spectrophotometry

Molecular Absorption Spectrophotometer

GENESYS UV‒Vis

2.4. Microbiological Analysis
The importance of bacteriological analysis of water is not to carry out an inventory of all the present species but to look for either those that are likely to be pathogenic or often those that accompany them and are present in greater numbers, often in the intestines of mammals, and whose presence is indicative of fecal contamination . The germs sought in the water studied were total coliforms, intestinal enterococci, and Clostridium perfringens. These microorganisms were identified and counted by filtering aliquots through a membrane of cellulose esters with a pore diameter of 0.45 µm . The results are reported as colony-forming units (CFUs) per 100 mL. First, 50 ml samples were filtered. After incubation, the culture of Petri dishes in which colonies could not be quantified (too many colonies > 200) was repeated with smaller volumes (2 mL, 10 mL, 20 mL). Germ culture was carried out on specific bacterial media at various temperatures, according to Table 2. All the Petri dishes were incubated for 24 hours.
Table 2. Methods used for microbiological analysis.

Parameters

Method

Culture medium

Incubation (Temperature/Time)

Total coliforms

Membrane filtration (0.45 µm)

Lauryl Sulfate

37°C/24 h

Faecal coliforms

Lauryl Sulfate

44°C/24 h

Faecal Enterococci

Fresh Blood Agar

37°C/24 h

Clostridium perfigens

Tryptone Sulfite Neomycin

37°C/24 h

2.5. Chlorine Determination and Breakpoint Curve
Determining the chlorine demand of a water source enables us to evaluate the amount of chlorine required to achieve a specified residual chlorine concentration after a set contact time of two hours . In a series of bottles, each containing 100 mL of the water to be analyzed, increasing chlorine concentrations are added. The bottles were then capped, shaken, and stored in the dark. After the two-hour defined contact time, free residual chlorine and total chlorine were measured using the N, N-diethylphenylene-1,4-diamine (DPD) method. The total and free chlorine contents were determined using DPD-3 and DPD-1 from Lovibond Water Testing materials , a MD200 photometer system at a wavelength of 530 nm (NF EN ISO 7393-2) and in the range of 0.03-5 mg/L Cl2. The chlorine demand of the water is identified by the first bottle, in which free chlorine is detected at 0.2 mg/L after the specified contact time . For all samples, a comparison with the blank value was used for chlorine value determination. Fresh hypochlorite solutions were prepared for each assay at a concentration of 1 g/L Cl2 with Ca(OCl)2 powders and calibrated using the iodometric method .
2.6. Survey
A survey carried out in March 2023 involved interactive exchanges with households that use water from the sampled boreholes. A total of seventy-four (74) individuals were surveyed, all of whom were adults living in households supplied by the sampled boreholes, to assess their knowledge of good hygiene, sanitation practices, and disinfection processes for drinking water. The survey consisted of interactive exchanges with households that used the water from the boreholes sampled. The distance between septic tanks and boreholes was measured to assess the safeguard zone between septic tanks and water sources.
3. Results and Discussions
3.1. Field Survey
The survey revealed that 84% of boreholes were drilled between 2018 and 2023, which corresponds to the period when the city was expanding towards the outlying districts (Elimdè, Leziyo, Atéda) and when there were major water shortages in the supply of drinking water. This period also coincided with the arrival of Indian drilling companies, which brought prices down from approximately 3 million to 1,500,000 or even less in some negotiation cases. Nearly 85% of the respondents said they had no knowledge of the concept of groundwater-related water-borne diseases. All the households had latrines and septic tanks. The distance between septic tanks and boreholes was between 8 and 37 m, with 14 boreholes (43.75%) not conforming to the commonly accepted value of ≥15 m to limit microbial transport. It is evident that groundwater resources in the city of Kara are at risk of pollution due to rapidly growing populations and changes in land use with abrupt urbanization. Sewage and poor sanitation conditions are related to high microbial and other anthropogenic contamination in sub-Saharan Africa . Hence, the idea of minimizing safe distances is a good first-line site-specific management option for protecting the immediate areas around groundwater sources .
The survey revealed that only 3% of households have already carried out at least one quality control analysis of their borehole water, despite the existence of the water code promulgated by the Togolese government . Indeed, it is stated in the Water Code (Article 72) that water intended for human consumption must be safe to drink, whether it is supplied through public water distribution networks or sourced from a well, borehole, or any other source used to provide water to the public. The code also stipulates that safeguard zones and protected areas should be defined by the ministry in charge of water protection to ensure the sustainable protection of groundwater resources. There are organisations in place to assist people in testing their borehole water, such as the National Institute of Hygiene (INH), which serves as the central public health laboratory, and water science-based laboratories in public universities of Togo.
The Togolese water code (article 87) stipulates that in areas served by a public drinking water distribution network, the use of well or borehole water for domestic, administrative, or commercial purposes may be suspended by ministers responsible for water and health if the quality of the well or borehole water cannot be guaranteed in the same way as that of the network. The enforcement of legislation concerning borehole development standards and monitoring water quality is crucial for the long-term use of borehole water.
3.2. Distribution of Physicochemical Parameters
3.2.1. Physicochemical Characteristics of Water
The descriptive statistics of the measured parameters used are presented in Table 3. The pH values of the water range between 6.8 and 7.9 in both the dry and rainy seasons. These waters comply with WHO guidelines, which specify acceptable pH values between 6.5 and 8.5 for drinking water.
The electrical conductivity (EC) values varied from 219 to 2120 µS/cm, with a mean value of 577.6 ± 290.7 µS/cm in the dry season, and from 217 to 2180 µS/cm, with a mean value of 598.6 ± 291.51 µS/cm. Taking into account the EC precision of approximately 1 to 2%, these EC values suggest pretty similar water mineralisation levels during both seasons. A high coefficient of variation (CV) was observed. The same trend of high values of standard deviation and coefficient of variation (CV) was observed for the main constituents except pH during the dry and rainy seasons (Table 3). These values reflect the heterogeneity of the aquifer zone, which is likely due to different recharge rates and mineral release rates, leading to variations in electrical conductivity .
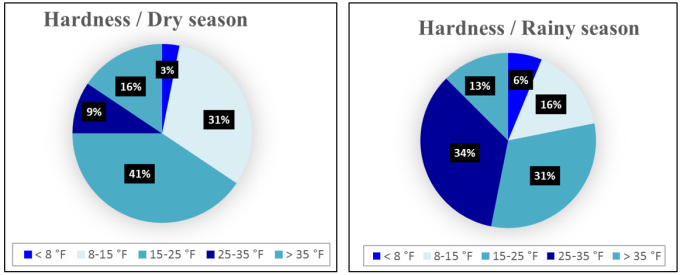
Figure 2. Water Classification Diagram Based on Hardness.
Groundwater hardness is an important parameter for assessing water quality. For water intended for human consumption, the WHO does not recommend a specific limit for hardness but notes that high hardness (>15 °F) can lead to the formation of calcium carbonate, whereas low hardness may cause corrosion issues. The diagrams in Figure 2 show that the water from the sampled boreholes during the dry season is predominantly characterized as moderately hard (41%) or soft (31%). In contrast, during the rainy season, borehole water is hard (34%) and moderately hard (31%), indicating the influence of rock dissolution
Among the mineral nitrogen compounds ( , , ), only nitrates have high concentrations, exceeding the related WHO standard. 17 samples against 13 have a concentration of below the method limit of detection (MLD) of <0.001 mg/L in the dry and wet seasons, respectively. This trend is striking for , where all values are below the MDL for both seasons.
Overall, nitrate concentrations are higher in the rainy season than in the dry season. In addition, the maximum concentrations in both seasons (101 mg/L) were recorded in the rainy season, up to more than twice the admissible concentration (50 mg/L) according to the WHO standards. This value was exceeded in some boreholes, namely, F12, F25, and F29 in the dry season and F9, F11, F12, F15, F25, and F30 in the wet season. This is risky for vulnerable populations, such as infants and elderly people, because of the potential formation of methaemoglobin in these organisms . Endogenous nitrite ions produced by exogenous high nitrate intake or nitrite react with the Fe(II) ions present in haemoglobin and produce Fe(III) ions, thus transforming haemoglobin into methaemoglobin, which could be lethal when the percentage of methaemoglobin in the blood reaches 80% .
Table 3. Descriptive statistics of selected physicochemical parameters in borehole water samples collected from the city of Kara.

Parameters

Dry season (n=32)

Min

Max

Mean

StD

CV

WHO Standards (mg/L)

Not conformed groundwater sources

% out of standards range

Colour (mg/L PtU)

0

112

15.47

22.68

146.63

≤ 15

8 (F1, F2, F4, F6, F8, F12, F21, F30)

25

pH

6.79

7.9

7.32

0.24

3.27

6.5 - 8.5

0

0

Turb (NTU)

0.22

20.3

2.5

3.48

138.99

< 5

5 (F2, F4, F6, F8, F30)

15.52

Cond (µS/cm)

219

2120

577.56

290.68

50.33

400 to 800

5 above 800 (F8, F9, F11, F25, F29)

9.38

Mineralisation (mg/L)

149.3

1499.84

411.81

200.56

48.7

1000

1 (F8)

3.12

TA (°F)

0

0

0

0

NA

0

0

TAC (°F)

5.4

33

18.85

4.41

23.41

5 to 30

2 (F11, F25)

6.25

HCO3- (mg/L)

65.88

402.6

230.01

53.84

23.41

-

Cl- (mg/L)

17.75

191.7

55.34

30.51

55.13

< 250

0

0

TH (°F)

5.8

61

21.33

10.29

48.23

≤ 15

21 (only F3 to F7; F10, F16. F18, F28, F30, F31 are conform)

65.63

Ca2+ (mg/l)

16

1344

48.09

20.69

43.02

-

Mg2+ (mg/l)

2.92

97.2

22.61

15.56

68.82

-

Oxydability (mgO2/L)

0

2.15

0.25

0.36

146.43

< 5

0

0

NH4+ (mg/L)

0.04

0.06

0.05

0.01

12.23

< 1.5

0

0

NO2- (mg/L)

< 0.001

< 0.001

< 0.001

NA

NA

< 3

0

0

NO3- (mg/L)

0.33

78.37

13.56

17.14

126.43

< 50

3 (F12, F25, F29)

9.38

FeT (mg/L)

0.01

1.96

0.24

0.44

185.32

< 0.3

3 (F8, F21, F30)

9.38

SO42- (mg/L)

1.91

157.33

22.6

20.45

90.49

< 250

0

0

SO2 (mg/L)

12.1

108.54

50.34

14.59

28.99

PO43- (mg/L)

0.09

0.46

0.28

0.15

53

Table 3. Continued.

Parameters

Rainy Season (n=32)

Min

Max

Mean

StD

CV

WHO Standards (µg/L)

Not conformed groundwater sources

% out of standards range

Colour (mg/L PtU)

0

121

11.81

16.32

138.18

≤ 15

8 (F1, F2, F4, F6, F8, F12, F21, F30)

25

pH

6.8

7.9

7.4

0.2

2.7

6.5 - 8.5

0

0

Turb (NTU)

0.14

21.2

1.96

2.72

138.63

< 5

1 (F30)

3.12

Cond (µS/cm)

217

2180

598.56

291.51

48.7

400 to 800

5 above 800 (F8, F9, F11, F25, F29)

9.38

Mineralisation (mg/L)

149

1500

412

201

48.7

1000

1 (F8)

3.12

TA (°F)

0

0

0

0

NA

TAC (°F)

6.4

31.8

17.23

4.36

25.31

5 to 30

1 (F26)

3.12

HCO3- (mg/L)

78.08

387.96

210.15

53.18

25.31

-

Cl- (mg/L)

10.65

95.85

35

18.26

52.18

< 250

0

0

TH (°F)

4

68

25.21

10.25

40.65

≤ 15

25 (only F3 to F5; F7, F10, F28, F31 are conform)

78.12

Ca2+ (mg/l)

12

159.2

58.3

25.81

44.27

Mg2+ (mg/l)

2.43

68.53

25.85

12.56

48.58

Oxydability (mgO2/L)

0

2.42

0.56

0.4

71.04

< 5

0

0

NH4+ (mg/L)

0.03

0.07

0.04

0.01

18.83

< 1.5

0

0

NO2- (mg/L)

< 0.001

< 0.001

< 0.001

NA

NA

< 3

0

0

NO3- (mg/L)

0.53

101.37

25.98

21.78

83.86

< 50

6 (F9, F11, F12, F15, F25, F30)

18.8

FeT (mg/L)

0.01

2.12

0.28

0.48

172.27

< 0.3

3 (F8, F21, F30)

9.4

SO42- (mg/L)

1.1

153.6

33.19

30.64

92.33

< 250

0

0

SO2 (mg/L)

7.9

83.03

40.34

17.57

43.55

PO43- (mg/L)

< 0.001

< 0.001

< 0.001

NA

NA

0

0

The presence of nitrate in groundwater could be linked to the development of urban livestock farming and excessive fertilization of urban agricultural areas with nitrogenous fertilizers, various types of manure, and even sewage sludge . The increasing concentration in the rainy season indicates the contaminant load during rainwater infiltration. Previous studies in Kara on private boreholes have shown that nitrogen pollution is closely linked to nitrate ions. This tendency was observed in Doukkala in Morocco through nitrogen mass balance , indicating that the use of fertilizers in the off-season, the type of crops, and culture can indeed influence the leaching of nitrogen in the form of nitrate.
The recommended total iron concentration should be less than 0.3 mg/L in the water during both seasons. In this study zone, the values ranged from below the MDL (< 0.03 mg/L) to approximately 2 mg/L in both the dry and rainy seasons, with nearly 10% of the boreholes (F8, F21, and F30) being strongly correlated with the geological formation of UKN, with values above the limits. The variability across the study zone is very similar based on standard deviation, and boreholes whom concentrations are above the recommended values, are the same in each season, confirming the geological source of iron.
Iron develops turbidity and a reddish color in the water, especially when the dissolved oxygen content is low , which is not very appealing to consumers. It also has the drawback of staining clothes and producing an unpleasant taste that can be perceived at concentrations of 0.05 mg/L or more .
Turbidity values meet the WHO recommendations (≤ 5 NTU) for most groundwater. Only the values for boreholes F2, F4, F6, F8, and F30 in the dry season and F30 in the rainy season are above 5 NTU. Turbidity is a parameter easily perceived through macroscopic aspects of water (clear with/without suspended solids, only suspended solids, and slightly reddish in color) by consumers and can indicate the microbiological quality of water. High turbidity can affect the effectiveness of disinfection treatments . Upon exposure to the atmosphere, iron oxidation leads to an objectionable reddish-brown color and increased turbidity , as implicitly confirmed by the strong correlation (0.76) with FeTotal during the dry season. We note that F8 and F21 present slightly reddish water and high color values.
Chloride ion concentrations remain below the recommended value of 250 mg/L throughout the year but are, on average, higher during the dry season (55.34 mg/L) than during the rainy season (35 mg/L). The lower values in the rainy season might have resulted from the dilution effect. Although groundwater mineralization seems to occur under steady conditions, during the rainy season, the chloride concentration decreases, whereas the nitrate concentration increases.
3.2.2. Corrosion Index
For many years, some authors have used the Langelier index to indicate water corrosivity . However, the use of the Langelier index, a calcium carbonate-based saturation index, such as indicators of water corrosivity across different materials, is limited. While these indices primarily indicate the tendency to deposit or dissolve calcite scales, they are unreliable predictors of corrosivity. For example, waters with a negative Langelier index can be noncorrosive, whereas the opposite result is observed for a positive Langelier index. However, saturation indices have been used in corrosion control, particularly in forming protective calcite scales in iron pipes. High pH, calcium, and alkalinity generally correlate with less corrosive water, but these indices are less effective for copper systems. The Larson ratio (1) considers the chloride, sulfate, and bicarbonate concentrations and is more useful for assessing water corrosiveness. It is developed from the relative corrosive potential of chloride and sulfate ions to the protective potential of bicarbonate. Any value above LR = 0.5 for water tends to be corrosive.
LR=Cl-+SO42-[HCO3-] (1)
where the concentrations are in meq/L.
Some boreholes present groundwater with a tendency to corrode in one season but lose it in another season. F3, F5, F7, F25, F31, and F32 presented LR values higher than 0.5 only in the dry season compared with F15, F24, and F30 in the rainy season.
In contrast, F8, F9, F11, F12, F21, F25 and F27 tended to be corrosive during both seasons. High levels of corrosion can be anticipated for F8 and F25 with LR >1.2. Corrosion may cause structural failure, leakage, and deterioration of chemical and microbial water quality . It appears that electrochemical tests remain an efficient approach to characterize corrosion and scale formation processes, including continuous hydrodynamic information on relevant factors .
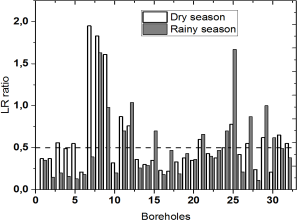
Figure 3. Larson ratios for the 32 sampled boreholes.
3.2.3. Correlations Among Physicochemical Parameters
Table 4 presents the values of the correlation matrix between parameters. High positive correlations were observed between turbidity, FeT and NH4+ during both seasons, suggesting that these ion sources control turbidity. The EC is highly correlated with Ca2+, Mg2+, and strong acid anions. A greater correlation between NO3- and EC, Ca2+, Cl-, and SO42-, particularly in the rainy season, suggests anthropogenic control of groundwater mineralization. A significant correlation between HCO3- and cations is expected in basement terrain dominated by silicate minerals . However, no significant correlations were observed between HCO3- and EC and the other parameters except for Mg2+ and Cl- during the dry season. This might result from the blurring of natural water‒rock interactions caused by anthropogenic contamination from urban infiltration, wastewater, and sewage. During the rainy season, a correlation is observed between Ca2+, SO42-, and NO3- and, to a lesser extent, between Mg2+ and FeT. This indicates a complex effect from the weathering of local rocks, such as chlorites, amphibolites, and pyroxenites , as well as an influence from anthropogenic pollution . The latter introduces SO42- and NO3- into groundwater, stemming from fossil fuel combustion, agricultural activities, and leaching from soils near illegal dump sites.
Table 4. Correlation matrix of the dry season (a) and rainy season (b) with selected parameters.

Variables

Turb

Cond

Ca2+

Mg2+

FeT

NH4+

HCO3-

Cl-

SO42-

NO3-

SiO2

Turb

1

(a)

Cond

0,477

1

Ca2+

0,330

0,763

1

Mg2+

0,037

0,698

0,509

1

FeT

0,759

0,576

0,470

0,151

1

NH4+

0,538

-0,013

-0,067

-0,207

0,326

1

HCO3-

-0,128

0,415

0,392

0,519

-0,047

-0,203

1

Cl-

-0,028

0,703

0,485

0,615

0,092

-0,246

0,501

1

SO42-

0,569

0,754

0,589

0,216

0,721

0,086

-0,049

0,340

1

NO3-

-0,277

0,313

0,215

0,646

-0,182

-0,096

0,203

0,407

0,032

1

SiO2

0,151

0,202

0,124

0,291

0,253

-0,129

0,124

-0,063

0,171

0,130

1

The values in bold are different from zero at a significance level of α = 0.05.

Variables

Turb

Cond

Ca2+

Mg2+

FeT

NH4+

HCO3-

Cl-

SO42-

NO3-

SiO2

Turb

1

Cond

-0,037

1

Ca2+

0,032

0,892

1

(b)

Mg2+

-0,160

0,671

0,565

1

FeT

0,486

0,546

0,441

0,393

1

NH4+

0,461

0,160

0,124

-0,033

0,314

1

HCO3-

-0,028

0,082

0,107

0,082

0,047

0,028

1

Cl-

0,003

0,879

0,884

0,555

0,461

0,059

0,085

SO42-

-0,088

0,851

0,775

0,662

0,485

0,061

0,017

0,761

1

NO3-

-0,311

0,610

0,664

0,389

-0,039

-0,009

-0,076

0,756

0,569

1

SiO2

-0,226

0,222

0,126

0,298

0,171

-0,055

-0,256

0,092

0,392

0,190

1

The values in bold are different from zero at a significance level of α = 0.05.
3.3. Microbiological Quality of the Water
Ensuring good bacteriological quality is crucial for safe drinking water, as harmful bacteria can cause serious health issues. Microbiological analyses revealed the presence of coliform bacteria, fecal enterococci, and Clostridium perfringens in the tested water samples (Figure 5). Across all the sampled boreholes, faecal contamination indicators were detected at 84.37% of the water points during the dry season, whereas they were detected at 96.87% of the water points during the rainy season. During the dry season, boreholes F1, F9, F10, F15, and F16 were free of the targeted microorganisms. During the rainy season, only borehole F10 exhibited good microbiological quality. All the water samples were free of thermotolerant coliform bacteria in both seasons and of Clostridium perfringens in the rainy season. The level of contamination was 62.50%, whereas it was 90.62% for total coliforms during the dry and rainy seasons, respectively. For faecal enterococci, there was a contamination rate of 81.25% in the rainy season. The results highlight more pronounced contamination during the rainy season than during the dry season, except for Clostridium perfringens. The results indicate that the coefficient of variation (CV) remains relatively low (<10) in both the rainy and dry seasons. This is concerning for groundwater, as it suggests a potential risk of persistent contamination in the tanks before water distribution to households. Furthermore, the lack of correlation between microbial contamination (Figure 5) and safeguard distance suggested a lack of inadequate maintenance of water reservoirs within the households.
These results align with findings reported by other researchers on the microbiological pollution of borehole water used for domestic purposes in underprivileged areas of developing countries . Although boreholes are among the primary drinking water sources, there is a notable presence of microbiological contamination from faecal and pathogenic microorganisms, in addition to physical and chemical pollution. The presence of coliforms, faecal streptococci, and Clostridium perfringens in water primarily originates from animal or human faecal contamination and can cause gastroenteritis, such as diarrhoea, nausea, vomiting, and abdominal cramps . There is also the possibility that dangerous pathogenic germs are present in the water. In fact, faecal indicator organisms such as thermotolerant coliforms cannot be used as indicators for pathogens such as Vibrio cholerae, Aeromonas spp., Campylobacter spp., and Helicobacter pylori, etc., which are responsible for diarrhoea, severe diseases (such as septicaemia), epidemic diseases (such as cholera), and chronic conditions (such as cancer) . Acts related to the water code need to be enforced, and the population needs to be aware of the importance of water resource protection and disinfection before consumption .
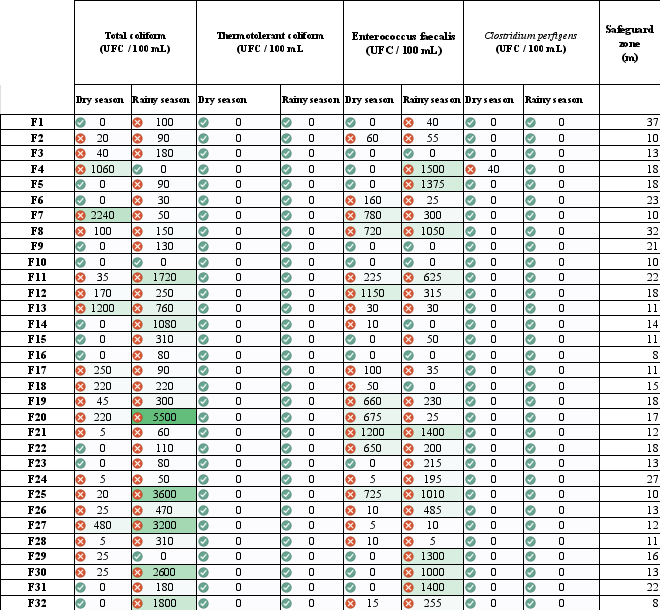
Figure 4. Distribution of microbiological indicator germs.
Table 5. Descriptive statistics of the microbiological parameters of the borehole water samples collected from the city of Kara.

Total coliform (UFC/100 mL)

Thermotolerant coliform (UFC/100 mL)

Enterococcus faecalis (UFC/100 mL)

Clostridium perfigens (UFC/100 mL)

Dry season

Rainy season

Dry season

Rainy season

Dry season

Rainy season

Dry season

Rainy season

Min (UFC/100 mL)

0,00

0,00

0,00

0,00

0,00

0,00

0,00

0,00

Max (UFC/100 mL)

2240,0

5500,00

0,00

0,00

1200,00

1500,00

40,00

0,00

Mean (UFC/100 mL)

193,44

737,19

0,00

0,00

226,25

410,31

1,25

0,00

STD

469,04

1289,52

0,00

0,00

367,40

525,29

7,07

0,00

CV%

2,42

1,75

NA

NA

1,62

1,28

5,66

NA

% of contaminated sample

62,5

90,63

0

0

62,5

81,25

3,13

0

3.4. Chlorine Demand (CD)
The chlorine demand varied from 0.25 to 6.1 mg/L, with an average of 0.82 mg/L, during the dry season and from 0.25 to 2.4 mg/L, with an average of 0.93 mg/L, during the rainy season (Table 6). On average, the chlorine demand is within the same range during both seasons. However, it varies from one point to another and seasonally across sites. Most points showed a tendency for chlorine demand to increase in the rainy season except for boreholes F5, F8 and F11, where the CD was relatively high in the dry season (Figure 5). The chlorine demand is influenced by the water temperature and the water residence time in the tank before distribution. Furthermore, water containing NH3, the conjugate base of NH4+ (with a pKa of 9.2 at 25°C), leads to increased chlorine consumption and results in the determination of the breakpoint on the curve of free chlorine as a function of total chlorine. The breakpoint curve provides a comprehensive view of the various types of chemicals that can consume chlorine during the disinfection process. When chlorine is added, the presence of reducing mineral compounds such as iron leads to almost instantaneous consumption, followed by reactions with ammonia nitrogen and humic substances derived from the decomposition of organic matter. These reactions occur at rates dependent on factors such as pH, water temperature, chlorine dose, and reaction time. Consequently, chlorine demand varies both spatially and temporally, as demonstrated in this study. The breakpoint curve form was not observed because of the low ammonium concentration (< 0.5 mg/L) in the sampled water. Thus, reported a good correlation between chlorine demand and highly polluted well water containing ammonium and organic matter. Many organic compounds are not fully oxidized in the oxidation test with KMnO4. In addition, bromide ions could be present in the deep aquifers of the boreholes sampled. Hypochlorous acid (HOCl), which is more abundant at pH<7.5, reacts with bromide ions (Br-) and hence interferes with the action of chlorine, particularly by interacting with natural organic matter . These various reactions lead to the production of chlorinated, brominated, or mixed organohalogenated compounds and increase the consumption of hypochlorous acid.
The potential health consequences of microbial contamination are that its control should always be at first on priority lists and should never be compromised. After chlorine demand, all the water samples were checked for microbiological contamination. They were found to be exempt from faecal contamination, indicating the effectiveness of chemical disinfection. Therefore, chlorine disinfection of a drinking water supply that is fully contaminated could reduce the overall risk of disease but may not necessarily render the water safe for drinking purposes. For example, chlorine disinfection of drinking water has limitations in addressing protozoan pathogens, especially Cryptosporidium , and some viruses, such as Vibrio cholerae . High turbidity levels can protect microorganisms from the effects of disinfection, encourage bacterial growth, and increase chlorine demand. An overall management strategy should be used in conjunction with disinfection to prevent or remove microbial contamination. Disinfection should remain a priority even when disinfection byproducts are managed .
This finding underlines the importance of determining site-specific chlorine demand rather than applying fixed values to avoid incorrect estimations, which can lead to either insufficient disinfection or the presence of harmful disinfection byproducts . Although there is no direct correlation between chlorine demand and the presence of indicator microorganisms, chlorination helps ensure good quality drinking water.
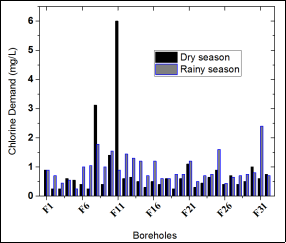
Figure 5. Chlorine demand over dry and rainy seasons of private borehole groundwater for 0.2 mg/L residual chlorine.
Table 6. Descriptive statistics about chlorine demand.

Chlorine demand (mg/L)

Dry season

Rainy season

Max

6,00

2,40

Min

0,25

0,25

Mean

0,82

0,93

Std

1,08

0,45

CV (%)

1,32

0,48

3.5. Contribution to Water Management in Kara
Seasonal variations were observed, with water quality generally deteriorating during the rainy season. The increased turbidity and microbial contamination during this period were probably due to surface water infiltration into the groundwater system. The need for household-based water treatment is worth considering. Multiple-barrier approaches, such as source water protection, as well as protection during storage and distribution within households, water boiling, solar radiation and chlorine disinfection, should be useful to ensure safe drinking water for the population of Kara city. These results also reflect the improper maintenance of water tanks within households for various reasons, such as the unavailability of skilled workers and increases in household expenditures. Likewise, it should be noted that registered drilling companies often offer assistance for water quality assessment as soon as their operations are completed before any consumption. Water quality should be monitored on a regular basis to ensure that it meets the safety standards set by public health authorities. To reduce contaminant loading into groundwater and address the social challenges faced, private boreholes and households using untreated groundwater should be registered to raise awareness among the population. Regular monitoring of the variation in groundwater quality should be undertaken to understand the health risks householders face, assess the challenges associated with chlorination at the household level, and propose alternative approaches to address these issues in the short and long term. Previous works revealed the effects of social factors, such as the belief that groundwater is drinkable and end-users tastes, just to mention a few, on the successful implementation of household-based chlorination. Since communities have their own recipe from local economic activities, community health-based projects should be prioritized over other valuable projects. Risk assessment, including quantitative microbial risk assessment, should be implemented locally since cities in Togo are in charge of their environment and water supply services. These four steps should be followed thoroughly: hazard identification, hazard characterization, exposure assessment, and risk characterization. Risk management and risk communication should be important steps forward to assure public health with well-identified stakeholders . Stakeholders who are highly decisive in raising awareness should be among district development committees, social actors in the municipality, traditional rulers, regional authorities, and multidisciplinary researchers (social, water, agroecology, physicians, etc.) to propose science-based solutions fit with Kara’s community mental model.
4. Conclusion
This study highlights the variations in groundwater quality and chlorine demand in private boreholes in Kara, Togo. The findings suggest that a one-size-fits-all approach to private borehole water chlorination will be ineffective. Instead, strategies considering social conditions, chlorination conditions and water quality are necessary to ensure safe drinking water supplies. Regular monitoring and adaptive management are recommended to address the hydrodynamic nature of groundwater quality. Further studies could investigate the concentration level of DBP from drinkable water distributed in the study zone, including chlorinated water from private boreholes. Monitoring of trace metals and pathogens could complement these results to assess the quality of drinking water from private boreholes in Kara.
Abbreviations

GDWQ

WHO Guidelines for Drinking Water Quality

DBP

Disinfection Byproducts

LR

Larson Corrosion Index

WHO

World Health Organization

TdE

Togolese Water Company

Acknowledgments
We thank the local authorities in Kara for their support during the data collection process and the laboratory team for their efforts in sample analysis. We thank the North Production Operations Director and the Head of Laboratory of Togolese Water Company (TdE), NOTO-KADOU-KAZA Tchani-Atana and TEBIE Esso-Nana, respectively.
Declarations
All authors have read, understood, and have complied as applicable with the statement on "Ethical responsibilities of Authors" as found in the Instructions for Authors.
Author Contributions
Akpénè Amenuvevega Dougna: Conceptualization, Formal Analysis, Investigation, Methodology, Project administration, Software, Supervision, Validation, Writing – original draft
Jeff Milibe Kolani: Formal Analysis, Investigation, Methodology, Validation, Writing – original draft
Kossitse Venyo Akpataku: Writing – original draft, Writing – review & editing
Ibrahim Tchakala: Writing – review & editing
Lallébila Tampo: Writing – review & editing
Alfa-Sika Mande Seyf-Laye: Writing – review & editing
Moctar Limam Bawa: Writing – review & editing
Funding
No funding was received to conduct this study.
Data Availability Statement
The data presented in this study can be provided upon request from the corresponding author.
Conflicts of Interest
The authors declare no conflicts of interest.
References
[1] Hounsounou, E. O., Agassounon Djikpo Tchibozo, M., Kelome, N. C., Vissin, E. W., Mensah, G. A. et Agbossou, E. (2017) Pollution des eaux à usages domestiques dans les milieux urbains défavorisés des pays en développement : Synthèse bibliographique. International Journal of Biological and Chemical Sciences, 10, 2392.
[2] Dougna, A. A., Gnazou, M. D.-T., Kodom, T., Djaneye-Boundjou, G. et Bawa, M. L. (2014) Physico-chimie et qualité des eaux des forages d’hydraulique villageoise dans la région centrale au Togo. International Journal of Biological and Chemical Sciences, 9, 2249.
[3] Grondin, P. M. (2005) Chloration en milieu rural dans les pays en voie de développement [Internet]. Programme Solidarité Eau.
[4] Rice, E. W., Bridgewater, L., APHA, AWWA et WEF. (2012) Standard Methods for the Examination of Water and Wastewater [Internet]. American Public Health Association.
[5] WHO. (2022) Guidelines for drinking-water quality. Fourth edition incorporating the first and second addenda. World Health Organization, Geneva.
[6] Nielsen, A. M., Garcia, L. A. T., Silva, K. J. S., Sabogal-Paz, L. P., Hincapié, M. M., Montoya, L. J. et al. (2022) Chlorination for low-cost household water disinfection – A critical review and status in three Latin American countries. International Journal of Hygiene and Environmental Health, 244, 114004.
[7] Jandova, J., Schiro, G., Duca, F. A., Laubitz, D. et Wondrak, G. T. (2024) Exposure to chlorinated drinking water alters the murine feacal microbiota. Science of The Total Environment, 914, 169933.
[8] Lacina, C., Dramane, D., Adama, C. et Germain, G. (2004) Utilisation des ressources en eaux, assainissement et risques sanitaires dans les quartiers précaires de la commune de Port-Bouët (Abidjan; Côte d’Ivoire). VertigO,
[9] Primature. (2021) Phase 2 du PASSCO, de l’eau potable dans la Kara et les Savanes à travers 600 forages [Internet].
[10] ATOP. (2023) Société / récurrence du problème d’eau à Kara : les mesures alternatives [Internet].
[11] Adewi, E. et Dubreuil, V. (2012) Variabilité Climatique et paludisme à Kara, une ville du Nord-Togo. 25ème Colloque de l’Association Internationale de Climatologie, Grenoble.
[12] Bawa, L. M., Tchakala, I. et Djaneye-Boundjou, G. (2008) Détermination de la demande en chlore des eaux de puits et de forages d’un quartier périurbain de la ville de Lomé : incidence sur la désinfection. Journal des Sciences et Technologie, 7, 19‑24.
[13] Tampo, L., Ayah, M., Kodom, T., Tchakakla, I., Boguido, P., Bawa, L. et al. (2014) Impact de la demande en chlore et de la chloration sur la désinfection des eaux de puits des quartiers de Lomé : cas des quartiers de Démakpoé et d’Agbalépédogan (Togo). Journal of Applied Biosciences, 75, 6272.
[14] Segbeaya, K. N. (2012) Evaluation de l’impact des déchets ménagers de la ville de Kara (Togo) sur la qualité de la rivière Kara. Université de Lomé et Limoges.
[15] INSEED. (2023) Présentation des principaux résultats définitifs du RGPH-5 [Internet].
[16] Fandjinou, K. (2019) Analysis of climate variability and its relations to vegetation dynamics in Togo, Western Africa from 1984 to 2017. Applied Ecology and Environmental Research, 17.
[17] INSEED. (2023) Annuaire statistique de la région de la Kara de 2020 et 2021 [Internet].
[18] Mairie de Kara. (2018) Plan de Développement Communal de Kara 2019 - 2023.
[19] Tairou, M. S. et Affaton, P. (2013) Structural Organization and Tectono-Metamorphic Evolution of the Pan-African Suture Zone: Case of the Kabye and Kpaza Massifs in the Dahomeyide Orogen in Northern Togo (West Africa). International Journal of Geosciences, 04, 166‑82.
[20] Rodier, J., Legube, B., Merlet, N. et Brunet, R. (2009) L’analyse de l’eau - 9e éd.: Eaux naturelles, eaux résiduaires, eau de mer. Dunod.
[21] Chippaux, J.-P., Houssier, S., Gross, P., Bouvier, C. et Brissaud, F. (2002) Etude de la pollution de l’eau souterraine de la ville de Niamey, Niger. Bulletin de la Société de Pathologie Exotique, 95, 119‑23.
[22] Owolabi, R. U. et Azeez, L. A. (2010) Transit Monitoring of Residual Chlorine in Awe-Oyo Area of Nigeria Water Township Supply. International Journal of Chemical Engineering and Applications, 143‑6.
[23] Psakis, G., Spiteri, D., Mallia, J., Polidano, M., Rahbay, I. et Valdramidis, V. P. (2023) Evaluation of Alternative-to-Gas Chlorination Disinfection Technologies in the Treatment of Maltese Potable Water. Water, 15, 1450.
[24] Shikongo-Nambabi, M. N.-N. N., Barbara, K. et Stephanus N, V. (2010) Evaluation of oxidising disinfectants to control Vibrio biofilms in treated seawater used for fish processing. Water SA, 36, 215‑20.
[25] Abascal, E., Gómez-Coma, L., Ortiz, I. et Ortiz, A. (2022) Global diagnosis of nitrate pollution in groundwater and review of removal technologies. Science of The Total Environment, 810, 152233.
[26] Lapworth, D. J., Nkhuwa, D. C. W., Okotto-Okotto, J., Pedley, S., Stuart, M. E., Tijani, M. N. et al. (2017) Urban groundwater quality in sub-Saharan Africa: current status and implications for water security and public health. Hydrogeology Journal, 25, 1093‑116.
[27] Rajkumar, Y. et Xu, Y. (2011) Protection of Borehole Water Quality in Sub-Saharan Africa using Minimum Safe Distances and Zonal Protection. Water Resources Management, 25, 3413‑25.
[28] Law n°2010 - 004 on the Water Code [Internet].
[29] Legube, B. (2021) Production d’eau potable: procédés de traitement, paramètres de qualité et impacts du changement climatique. 2e éd. Dunod, Malakoff.
[30] Bradberry, S. (2016) Methaemoglobinaemia. Medicine, 44, 91‑2.
[31] Hou, P., Jiang, Y., Yan, L., Petropoulos, E., Wang, J., Xue, L. et al. (2021) Effect of fertilization on nitrogen losses through surface runoffs in Chinese farmlands: A meta-analysis. Science of The Total Environment, 793, 148554.
[32] Wu, S., Bashir, M. A., Raza, Q.-U.-A., Rehim, A., Geng, Y. et Cao, L. (2023) Application of riparian buffer zone in agricultural non-point source pollution control—A review. Frontiers in Sustainable Food Systems, 7, 985870.
[33] Rahoui, M., Soudi, B. et Ahmad, F. I. (2000) Situation actuelle de la pollution nitrique des eaux souterraines dans le périmètre irrigué des Doukkala [Internet]. Transfert de Technologie en Agriculture.
[34] Zhang, H., Liu, D., Zhao, L., Wang, J., Xie, S., Liu, S. et al. (2022) Review on corrosion and corrosion scale formation upon unlined cast iron pipes in drinking water distribution systems. Journal of Environmental Sciences, 117, 173‑89.
[35] Ahmed, S., Sultan, M. W., Alam, M., Hussain, A., Qureshi, F. et Khurshid, S. (2021) Evaluation of corrosive behavior and scaling potential of shallow water aquifer using corrosion indices and geospatial approaches in regions of the Yamuna river basin. Journal of King Saud University - Science, 33, 101237.
[36] Ozair, G. (2012) An Overview of Calcium Carbonate Saturation Indices as a Criterion to Protect Desalinated Water Transmission Lines From Deterioration. Nature Environment and Pollution Technology, 11, 203‑12.
[37] Marconnet, C., Dagbert, C., Roy, M. et Féron, D. (2005) Comportement d’aciers inoxydables en eaux naturelles. Matériaux & Techniques, 93, s. 83-s. 90.
[38] Akpataku, K. V., Gnazou, M. D. T., Djanéyé-Boundjou, G., Bawa, L. M. et Faye, S. (2020) Role of Natural and Anthropogenic Influence on the Salinization of Groundwater from Basement Aquifers in the Middle Part of Mono River Basin, Togo. Journal of Environmental Protection, 11, 1030‑51.
[39] Gnazou, M., Assogba, K., Sabi, B. et Bawa, L. (2015) Qualité physico-chimique et bactériologique des eaux utilisées dans les écoles de la préfecture de Zio (Togo). International Journal of Biological and Chemical Sciences, 9, 504.
[40] Akpataku, K. V., Gnazou, M. D. T., Nomesi, T. Y. A., Nambo, P., Bawa, L. M. et Djaneye-Boundjou, G. (2020) Physicochemical and Microbiological Quality of Shallow Groundwater in Lomé, Togo. Journal of Geoscience and Environment Protection, 08, 162‑79.
[41] Soncy, K., Djeri, B., Anani, K., Eklou-Lawson, M., Adjrah, Y., Karou, D. et al. (2015) Évaluation de la qualité bactériologique des eaux de puits et de forage à Lomé, Togo. Journal of Applied Biosciences, 91, 8464.
[42] Kamanula, J. F., Zambasa, O. J. et Masamba, W. R. L. (2014) Quality of drinking water and cholera prevalence in Ndirande Township, City of Blantyre, Malawi. Physics and Chemistry of the Earth, Parts A/B/C, 72‑75, 61‑7.
[43] MacKeown, H., Von Gunten, U. et Criquet, J. (2022) Iodide sources in the aquatic environment and its fate during oxidative water treatment – A critical review. Water Research, 217, 118417.
[44] WHO et FAO. (2009) Principles and methods for the risk assessment of chemicals in food. World Health Organization, World Health Organization, Geneva. 18.
[45] Lundgren, R. E. et McMakin, A. H. (2013) Risk communication: a handbook for communicating environmental, safety, and health risks. 5e ed. Wiley IEEE press, Hoboken Piscataway.
Cite This Article
  • APA Style

    Dougna, A. A., Kolani, J. M., Akpataku, K. V., Tchakala, I., Tampo, L., et al. (2024). Quality and Chlorine Demand of Private Raw Borehole Water in the City of Kara, Togo. American Journal of Applied Chemistry, 12(6), 158-172. https://doi.org/10.11648/j.ajac.20241206.14

    Copy | Download

    ACS Style

    Dougna, A. A.; Kolani, J. M.; Akpataku, K. V.; Tchakala, I.; Tampo, L., et al. Quality and Chlorine Demand of Private Raw Borehole Water in the City of Kara, Togo. Am. J. Appl. Chem. 2024, 12(6), 158-172. doi: 10.11648/j.ajac.20241206.14

    Copy | Download

    AMA Style

    Dougna AA, Kolani JM, Akpataku KV, Tchakala I, Tampo L, et al. Quality and Chlorine Demand of Private Raw Borehole Water in the City of Kara, Togo. Am J Appl Chem. 2024;12(6):158-172. doi: 10.11648/j.ajac.20241206.14

    Copy | Download

  • @article{10.11648/j.ajac.20241206.14,
      author = {Akpénè Amenuvevega Dougna and Jeff Milibe Kolani and Kossitse Venyo Akpataku and Ibrahim Tchakala and Lallébila Tampo and Alfa-Sika Mande Seyf-Laye and Moctar Limam Bawa},
      title = {Quality and Chlorine Demand of Private Raw Borehole Water in the City of Kara, Togo
    },
      journal = {American Journal of Applied Chemistry},
      volume = {12},
      number = {6},
      pages = {158-172},
      doi = {10.11648/j.ajac.20241206.14},
      url = {https://doi.org/10.11648/j.ajac.20241206.14},
      eprint = {https://article.sciencepublishinggroup.com/pdf/10.11648.j.ajac.20241206.14},
      abstract = {The reliance on borehole water necessitates a thorough understanding of its quality. Due to water shortage, many households in the city of Kara use water from boreholes directly supplied untreated in the dry and wet seasons. Therefore, this work aimed to investigate the chlorine demand of raw water from private boreholes and perform a spatiotemporal evaluation of the water quality in the city of Kara, Togo. Two sampling campaigns spread over dry (DS) and rainy (RS) seasons in April and August 2023, were carried out to capture seasonal and spatial differences across various boreholes (n=32) in the study area. The physicochemical parameters and germ indicators of fecal contamination were assessed via the standardized method (AFNOR) and WHO Guidelines for Drinking Water Quality (GDWQ). The correlation matrix analysis revealed a complex effect from the dissolution of local rocks (amphibolites, pyroxenites, etc.) and anthropogenic activities. Water was noncompliant concerning faecal contamination in 84.3% of the cases in the dry season (DS) and 96.37% of the cases in the rainy season (RS). The color, TH, TAC, turbidity, FeT, nitrate ion, and electrical conductivity values for some boreholes were outside the GDWQ values. Boreholes F8, F9, and F25 have very high Larson corrosion index (LR>1.2). The chlorine demand varies according to the season, ranging from 0.25 to 6.0 mg/L in DS and from 0.25 to 2.45 mg/L in RS. Regular monitoring is needed to ensure safe drinking water from boreholes in Kara.
    },
     year = {2024}
    }
    

    Copy | Download

  • TY  - JOUR
    T1  - Quality and Chlorine Demand of Private Raw Borehole Water in the City of Kara, Togo
    
    AU  - Akpénè Amenuvevega Dougna
    AU  - Jeff Milibe Kolani
    AU  - Kossitse Venyo Akpataku
    AU  - Ibrahim Tchakala
    AU  - Lallébila Tampo
    AU  - Alfa-Sika Mande Seyf-Laye
    AU  - Moctar Limam Bawa
    Y1  - 2024/12/27
    PY  - 2024
    N1  - https://doi.org/10.11648/j.ajac.20241206.14
    DO  - 10.11648/j.ajac.20241206.14
    T2  - American Journal of Applied Chemistry
    JF  - American Journal of Applied Chemistry
    JO  - American Journal of Applied Chemistry
    SP  - 158
    EP  - 172
    PB  - Science Publishing Group
    SN  - 2330-8745
    UR  - https://doi.org/10.11648/j.ajac.20241206.14
    AB  - The reliance on borehole water necessitates a thorough understanding of its quality. Due to water shortage, many households in the city of Kara use water from boreholes directly supplied untreated in the dry and wet seasons. Therefore, this work aimed to investigate the chlorine demand of raw water from private boreholes and perform a spatiotemporal evaluation of the water quality in the city of Kara, Togo. Two sampling campaigns spread over dry (DS) and rainy (RS) seasons in April and August 2023, were carried out to capture seasonal and spatial differences across various boreholes (n=32) in the study area. The physicochemical parameters and germ indicators of fecal contamination were assessed via the standardized method (AFNOR) and WHO Guidelines for Drinking Water Quality (GDWQ). The correlation matrix analysis revealed a complex effect from the dissolution of local rocks (amphibolites, pyroxenites, etc.) and anthropogenic activities. Water was noncompliant concerning faecal contamination in 84.3% of the cases in the dry season (DS) and 96.37% of the cases in the rainy season (RS). The color, TH, TAC, turbidity, FeT, nitrate ion, and electrical conductivity values for some boreholes were outside the GDWQ values. Boreholes F8, F9, and F25 have very high Larson corrosion index (LR>1.2). The chlorine demand varies according to the season, ranging from 0.25 to 6.0 mg/L in DS and from 0.25 to 2.45 mg/L in RS. Regular monitoring is needed to ensure safe drinking water from boreholes in Kara.
    
    VL  - 12
    IS  - 6
    ER  - 

    Copy | Download

Author Information
  • Laboratory of Organic Chemistry and Environmental Science, Faculty of Science and Technology, University of Kara, Kara, Togo; Laboratory of Applied Hydrology and the Environment, Faculty of Science, University of Lomé, Lomé, Togo

  • Laboratory of Organic Chemistry and Environmental Science, Faculty of Science and Technology, University of Kara, Kara, Togo

  • Laboratory of Organic Chemistry and Environmental Science, Faculty of Science and Technology, University of Kara, Kara, Togo; Laboratory of Applied Hydrology and the Environment, Faculty of Science, University of Lomé, Lomé, Togo

  • Laboratory of Applied Hydrology and the Environment, Faculty of Science, University of Lomé, Lomé, Togo

  • Laboratory of Organic Chemistry and Environmental Science, Faculty of Science and Technology, University of Kara, Kara, Togo; Laboratory of Applied Hydrology and the Environment, Faculty of Science, University of Lomé, Lomé, Togo

  • Laboratory of Organic Chemistry and Environmental Science, Faculty of Science and Technology, University of Kara, Kara, Togo; Laboratory of Applied Hydrology and the Environment, Faculty of Science, University of Lomé, Lomé, Togo

  • Laboratory of Applied Hydrology and the Environment, Faculty of Science, University of Lomé, Lomé, Togo

  • Abstract
  • Keywords
  • Document Sections

    1. 1. Introduction
    2. 2. Materials and Methods
    3. 3. Results and Discussions
    4. 4. Conclusion
    Show Full Outline
  • Abbreviations
  • Acknowledgments
  • Declarations
  • Author Contributions
  • Funding
  • Data Availability Statement
  • Conflicts of Interest
  • References
  • Cite This Article
  • Author Information